Here are 5 significant Tampa Bay real estate trends over the past few years, based on data from the Greater Tampa Association of Realtors (GTAR) and My Florida Regional MLS:
1. The best selling Tampa Bay homes are those priced in the $200,000 to $250,000 range.
This range has been the best seller since the middle of 2012.
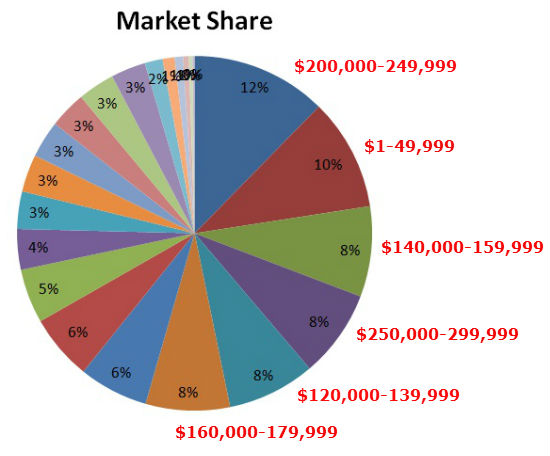
*Above graph is based on Greater Tampa residential sales from January 1 to October 31, 2014, as reported to GTAR.
| Top Sales Price Ranges | Market Share |
| 200,000 – 249,999 | 12.34% |
| 1 – 49,999 | 10.21% |
| 140,000 – 159,999 | 8.25% |
| 250,000 – 299,999 | 8.00% |
| 120,000 – 139,999 | 8.00% |
| 160,000 – 179,999 | 7.67% |
| 100,000 – 119,999 | 6.32% |
| 180,000 – 199,999 | 5.97% |
| 300,000 – 349,999 | 4.95% |
2. Home sellers have been getting 97% of their asking prices since March 2013.
This is a clear increase from the months and years prior to March 2013, when the ratios ranged from 93% to 96%.
3. The average sale price of Tampa Bay homes has been on an upward trend over the past four years.
The average sale price for January to October this year is $198,475.
Over the same period in 2011, the average sale price was $150,075.
4. Cash sales of condos and townhouses continue to be more than half of closed sales.
In October this year, 55% of condo and townhouse sales in the Greater Tampa area were paid in cash. In August and September, cash sales were 54% and 58% of closed sales, respectively.
The Tampa-St. Petersburg-Clearwater metro area was again listed by RealtyTrac and other market analysts in their Top 10 lists of markets based on cash sales.
In the first and second quarter, cash purchases in this metro area accounted for 55% and 63% of transactions, respectively.
5. Housing inventory is still declining.
As of October 2014, there were only 9,517 homes for sale in the Greater Tampa area, a big drop from 13,313 units in October 2013, from 15,209 in October 2011, and from 20,477 in October 2010.